Visualising historic map data in a modern Geographic Information System (GIS) setting
It goes without saying that with a rise in technological advancements and shared data, it bears reflection that mapping has come a long way. We thought it might be interesting to take one specific example of mapping diseases in a historic context and see how it might apply to a more modern setting, with the latest tools and innovations GIS mapping has to offer. How might it be planned? Does the original mapping stand the test of time?
Take a look at the map below. We have taken data from John Snow’s map of the 1854 London cholera epidemic to see if we can visualise it in a modern GIS and have also considered how else GIS is used in the mapping of diseases.
The 1854 Broad Street cholera outbreak
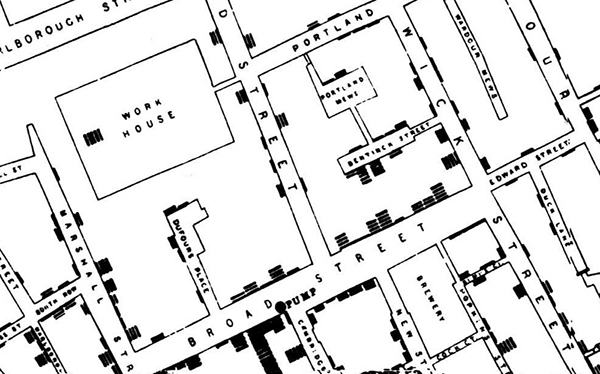
Soho in London saw a severe outbreak of Cholera in 1854 which killed over 600 people. At the time, the common theory was that it was caused by pollution or ‘foul air’. The physician, John Snow, had already discounted this idea. He talked to local residents and studied the geographical pattern of cholera cases and identified a water pump on Broad Street as the likely source of the disease. He convinced the local council to remove the handle from the suspect pump and this is credited as having ended the epidemic. A later discovery found that the pump was installed only a few feet away from a cesspit.
The distribution map that John Snow produced, showing a black bar for every case of cholera against each property, changed the way that disease was studied. He is regarded as being the founding father of Epidemiology (the analysis of the distribution of health and disease conditions).
Our GIS methodology for mapping diseases
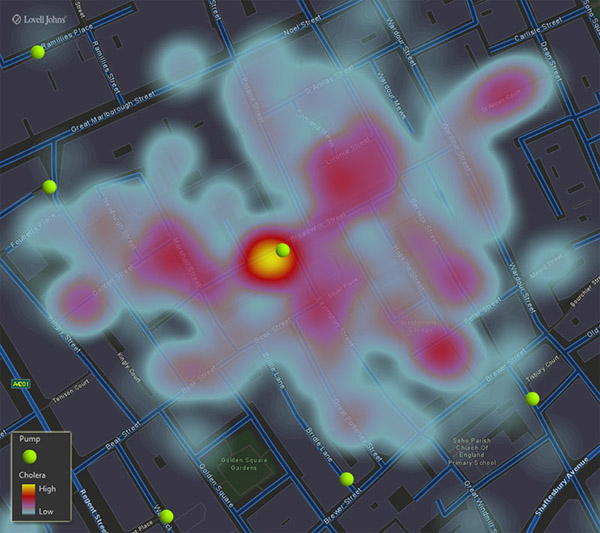
We used GIS to capture the locations of the properties on John Snow’s map, and attributed them with the number of cholera cases. We also captured the location of the water pumps in the area. Using Esri’s ArcGIS Pro software, we created a heat map of cholera cases and overlaid it against modern GIS mapping. The conclusion that the water pump (on what is now Broadwick Street) is located towards the centre of the outbreak is clear to see.
More data, more insights
GIS is used in modern epidemiology to understand how and why diseases occur, and also aiding preventative measures. In the case of the 1854 cholera epidemic, information was collected from residents. Nowadays, individuals are still an important source of data collection, but this is now complimented with data from health-care providers which may include a geographic element such as postcode data.
In epidemiology, non-health related data such as environmental factors, population distribution and deprivation are analysed alongside health data. Pollution data, for instance, could be analysed against an epidemic to help rule it out as a factor.
Knowing the location of cesspits before the installation of a water pump would have prevented the 1854 cholera outbreak. Now utilities companies hold accurate GIS data of sewers and drains to aid maintenance and construction planning.
GIS also allows us to communicate theories more clearly and faster than a printed map. For instance, if the dates of disease cases are recorded when they are discovered, then an animated visualisation can be created, showing the spread of a disease over time. In the age of social media, static and interactive maps are also easily shareable.
It isn’t just about analysing historical data either. NASA recently created forecasts of cholera outbreaks in Yemen using spatial information related to environmental conditions, sanitation and clean water infrastructure.
GIS software is being used to understand the source and spread of diseases, assisting in the prevention of outbreaks and forecasting areas at risk of epidemics using a range of spatial data.
Comments are closed here.