Geographic information is information that describes the locations of features on the Earth’s surface. A geographic information system (GIS) is any system which displays geographic features with related tabular data to allow a user to organise, map and analyse data in a geographic or spatial way. A GIS therefore allows us to understand and interpret features in the real world in a way that would not be possible with tabular data alone. Typically, a GIS can analyse spatial data and visualise results in the form of maps, reports and charts.
GIS requires specialist software and spatial data. Novice users are able to make use of elements of GIS, although professionals tend to carry out the more skilled data collation, analysis and reporting roles.
GIS Software
GIS software is designed to store, manage and analyse spatial data. Software can be desktop, server or mobile-based and range hugely in cost and functionality. Ever more sophisticated cheap or freely available software is available and widely used in the GIS community. Commercial software offers more scalability, support, ease of use and functionality designed specifically for many industry sectors such as housing, transport and energy. Much of this functionality is in the form of software extensions or plug-ins. In practice, GIS professionals may use a variety of systems.
Software development kits allow developers to customise GIS software and build new applications using the underlying GIS functionality. Cloud based software can be used to collaborate the collation, editing and publishing of map data between offices and those in the field in real-time.
Data
There are two main types of spatial data used in GIS. Vector data stores the coordinates of features (usually as a line, point or polygon) and links them to attribute data such as ID, names and categories. Raster data is cell-based and includes data categories such as topographic maps and satellite imagery. Raster data can also represent values such as elevation or temperature.
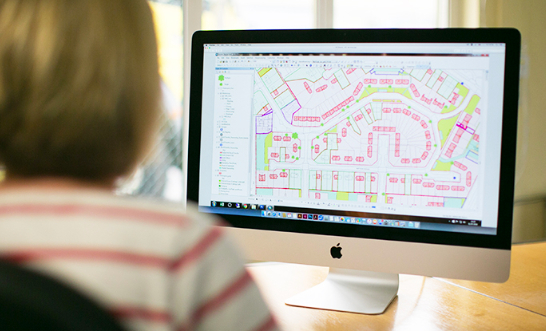
With a GIS, spatial data is organised in layers. Users are able to toggle layers on and off and interrogate the attribute information.
GIS data can be either be created or sourced and converted from existing data. Creating data usually involves a user interpreting features from imagery or scanned maps and capturing the features into a GIS layer. Some automatic recognition processes are available that use rules or even artificial intelligence to identify features automatically depending on how easily they can be interpreted from the source.
Some GIS data can be downloaded and used for free as long as the source is credited; other data can have certain restrictions or will need to be purchase commercially. Data can be obtained from local or national government websites, national mapping agencies (such as the Ordnance Survey), private vendors, or crowdsourcing initiatives such as OpenStreetMap.
GIS data can also be transformed from other environments including CAD and GPS. It can also be converted from any data with a spatial reference (such as a postcode) through the process of geocoding, whereby spatial references are matched against known coordinates. Even an Excel document with basic address information may be converted into a GIS vector layer.
Analysis
The true power of GIS over non-spatial databases is the ability to analyse data in a spatial manner. Patterns and relationships can be identified, either by exploring data visually or through specific geoprocessing tasks. Common tasks include proximity analysis (finding geographic features within a defined distance of another set of features) or finding the overlaps between multiple polygon layers. More complex tasks can include analysing data using service areas such as set travel times from certain locations, or analysing the change of data layers over time (such as temperature change).
Such tasks can be combined into larger workflows or models which can be used for more complex and repeat analysis. These can be refined by the GIS user, altering the order of the tasks or their input parameters. Models can also be the basis for more user-friendly applications which provide simple input options to allow the modelling of different scenarios and present the output.
Reporting and visualisation
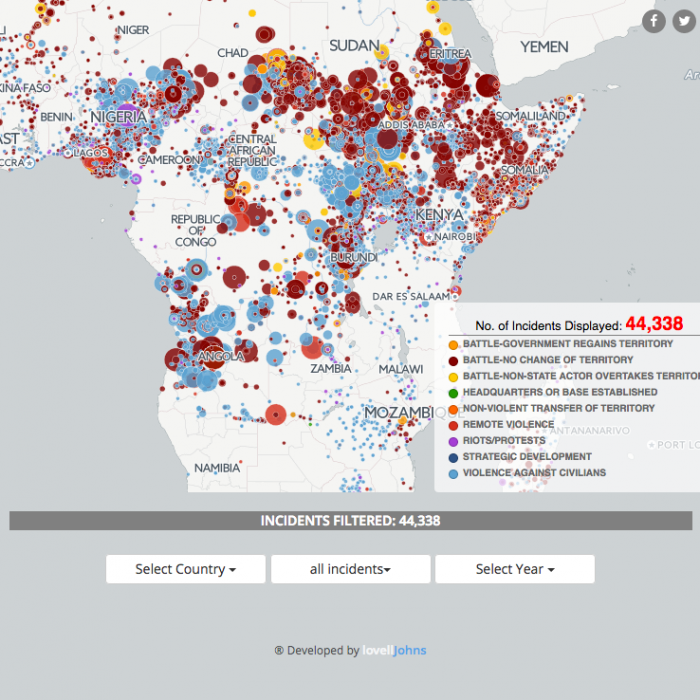
Effectively communicating spatial data or the results of analysis is key and different mediums are available. Maps can be produced direct from GIS for digital or hard copy publication. This can be combined with output tabular data in the form of tables and charts. Layered PDF document adds the ability for users to toggle data layers on and off. Lightweight online viewers can give a user a simplified GIS experience, allowing the interrogation of spatial features (such as assets) within layers within an interactive map environment. If the data has a temporal content, more sophisticated visualisations and animations can be created for videos and presentations.
With the right software, data and people, GIS can ultimately enable better efficiency, decision making and improve communication in almost any industry.
Comments are closed here.