Spatial analysis to support fuel poverty programme
Requirement
Founded in 1862, Peabody own and manage more than 20,000 homes across London. With tenures including social housing, leasehold, shared ownership, supported housing, key-worker accommodation and commercial units, Peabody also provide homes for market rent and outright sale to support the funding of affordable homes.
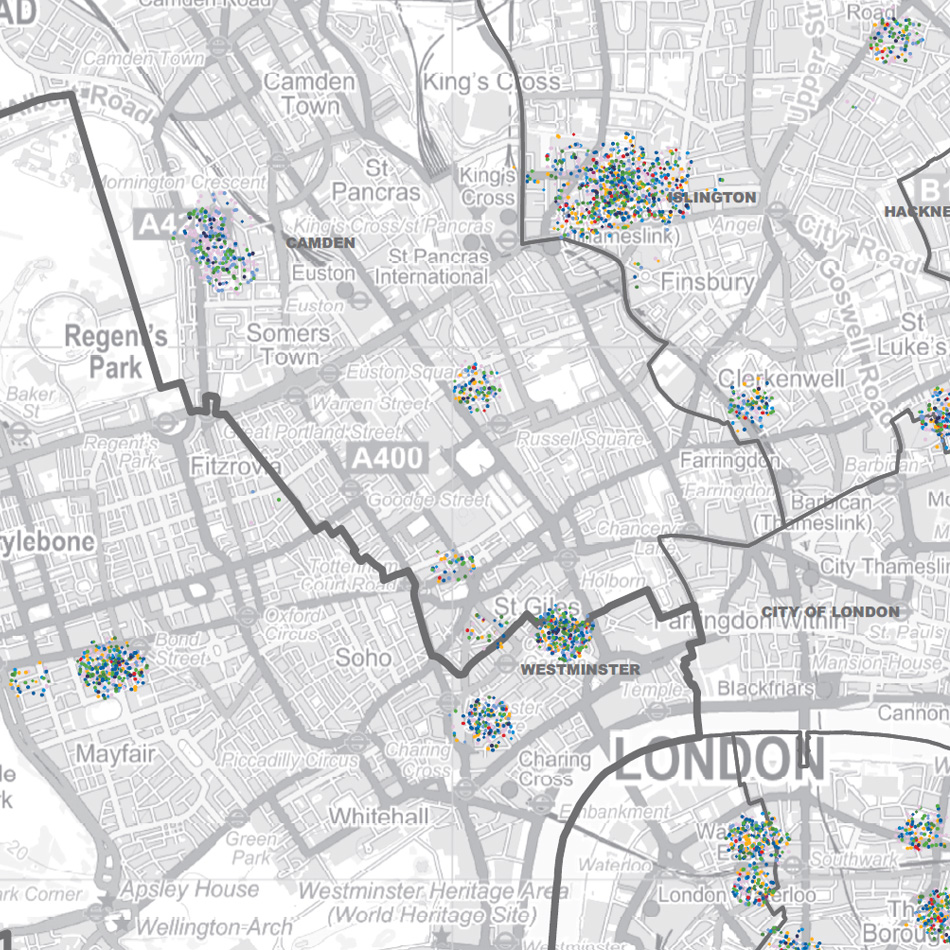
The Sustainability Manager for Peabody contacted Lovell Johns with a requirement for GIS based mapping as part of a project on fuel poverty amongst tenants. Starting with an Excel listing of over 4,500 residents aged over 55 years, the client was seeking to identify clusters of older residents in its housing portfolio to undertake some fuel poverty work.
Solution
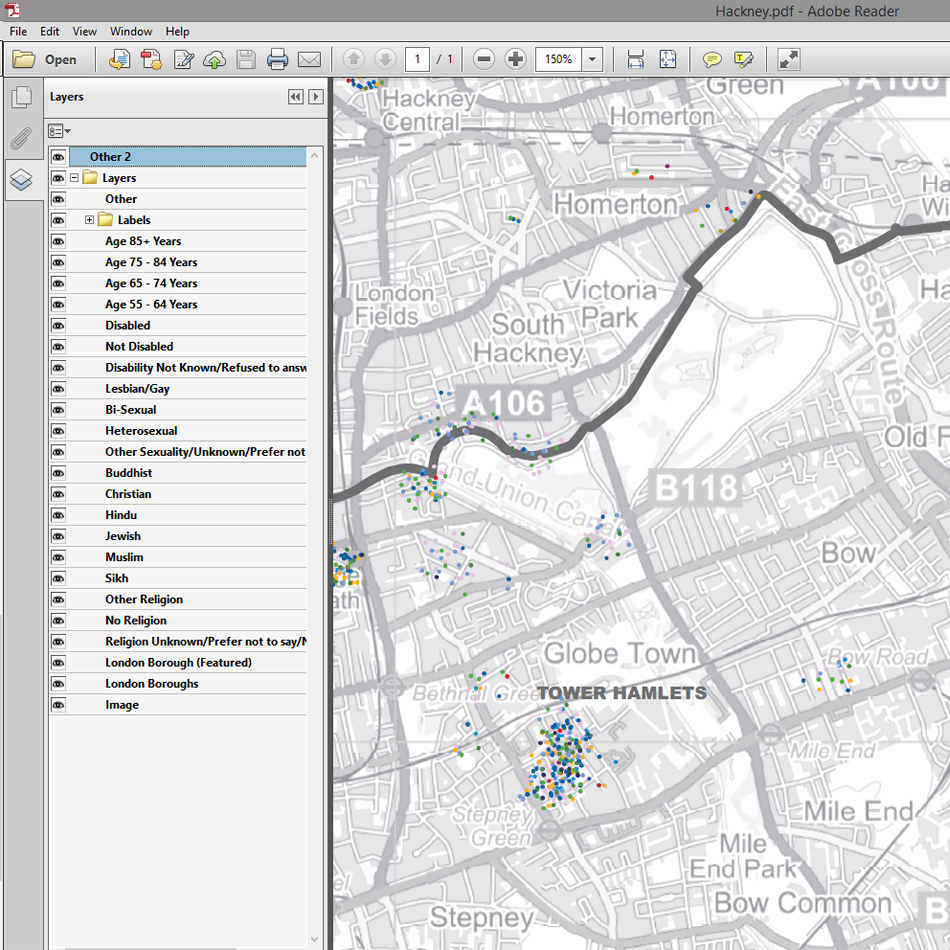
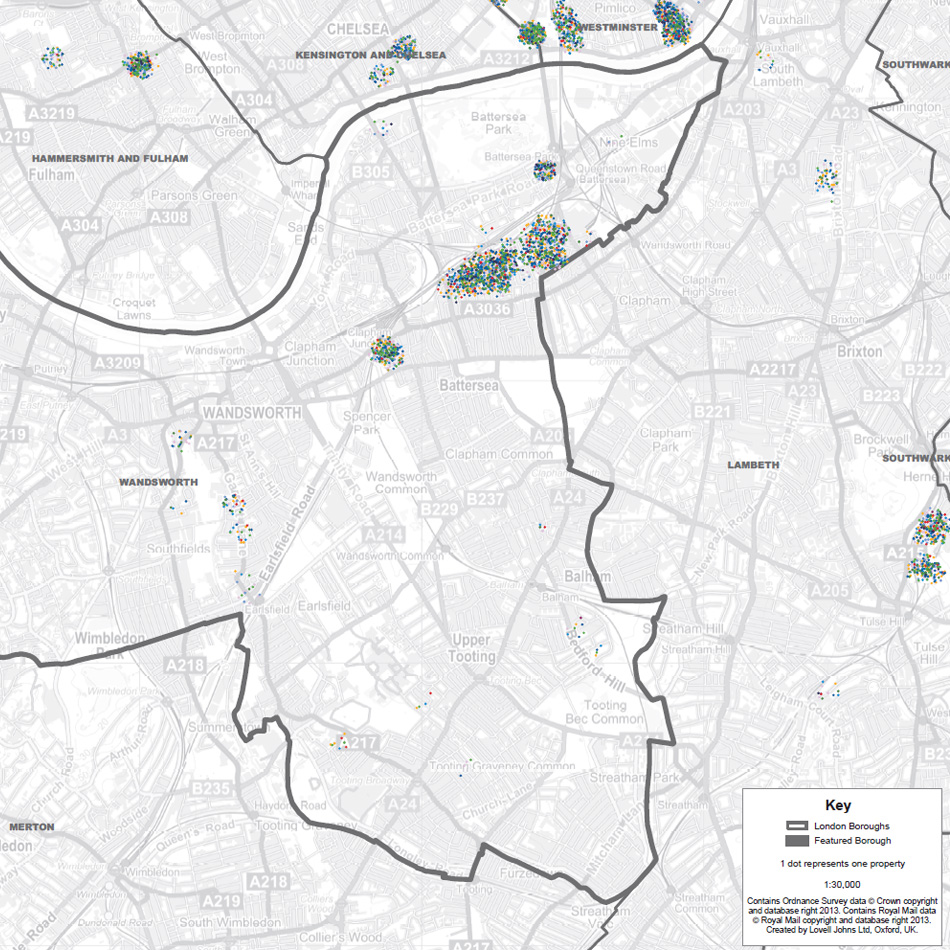
Property addresses were geocoded to their postcode centroid. Dot distribution maps were designed to allow visual analysis of the clusters based on age and other demographic categories, but without individual properties being able to be identified. Maps were supplied as layered PDF files, allowing the user to toggle on and off different demographic layers.
Result
“Lovell Johns produced layered maps which allowed us to identify different clusters of older people and other demographic categories so we could prioritise our work. Lovell Johns was professional and delivered high quality, layered GIS maps in a short timescale.” Graeme Maughan, Sustainability Manager.