Interactive map of African political violence over 20 years
We created an animated data visualisation and a detailed interactive map of political violence data in Africa over the last 20 years.
ACLED (Armed Conflict Location & Event Data Project) is the most comprehensive publicly available collection of political violence and protest data for developing states.
The project produces information on specific dates and locations of political violence and protest, the types of event, the groups involved, fatalities, and changes in territorial control. Specifically, information is recorded on the battles, killings, riots, and recruitment activities of rebels, governments, militias, armed groups, protesters and civilians.
With close to 200,000 individual events recorded, ACLED allows this data to be used for immediate and long-term analysis and mapping of political violence and protest across developing countries through use of historical data.
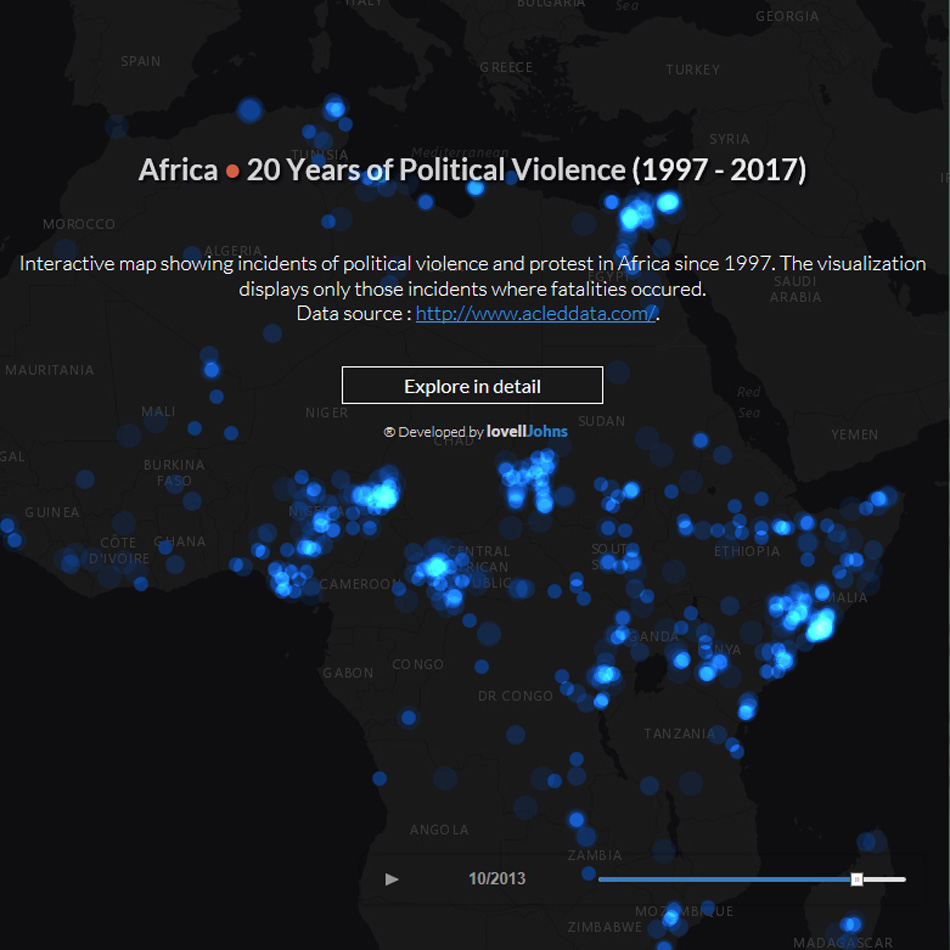
Animated data visualisation
We took ACLED geospatial data for Africa for the 20 year period from 1997 and created an animated data visualisation that communicates the density of political violence over time. The user can pause the animation and use the slide bar to show the data visualisation at a specific month.
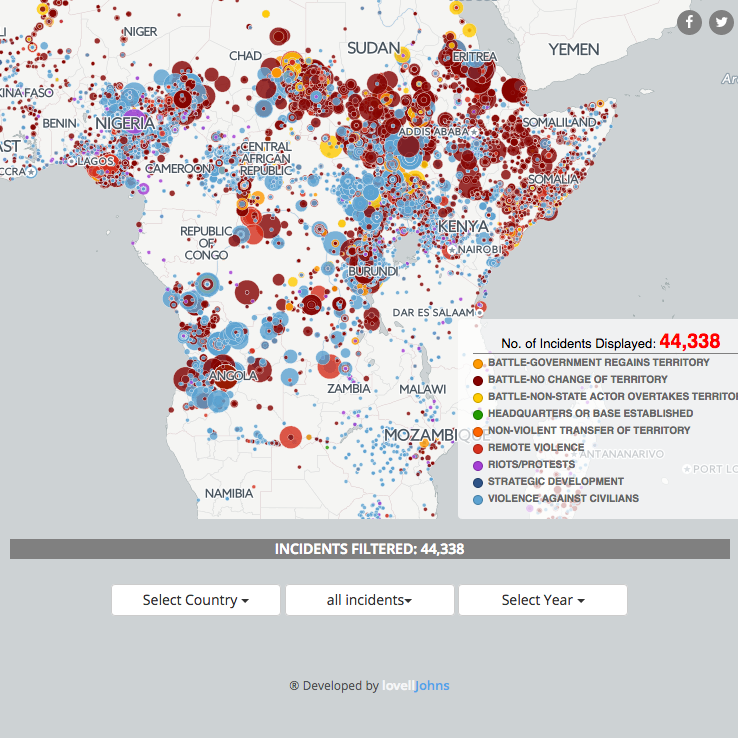
The detailed interactive map allows the user to explore in detail over 44,000 individual incidents across 20 countries. Specifically, the user can filter the total dataset by Country, by Incident type, and Year.