With the current financial issues faced by the public sector, the need for provision mapping is becoming increasingly important. Education, health and community-based services can all take advantage of GIS (Geographical Information Systems) to map and analyse current provision.
GIS can be used to:
- Locate and store your provision locations
- Analyse provision against demographics
- Suggest areas which lack provision
- Suggest areas that can be centralised
- Make and present maps
Provision first needs to be mapped or ‘geocoded’ to find a geographical position. GIS can be used to find approximate locations by postcode unit, or by full address. Within a GIS, your provision can be displayed and coloured by a category against background mapping.
Provision locations can be displayed against specific service-based boundaries such as Health Boards, Clinical Commissioning Groups or Local Education Authorities. Provision can be viewed or analysed against demographic data, such as that available from the 2011 Census. Other GIS layers, such as new roads or developments could also be brought in and used to analyse where provision should be increased in the future.
The case for increasing or centralising provision should be backed-up by the display of clear and concise maps that communicate your argument. GIS allows the creation of maps in PDF or raster format, as well as the creation of layered-PDF’s, that allow users to toggle on and off map layers.
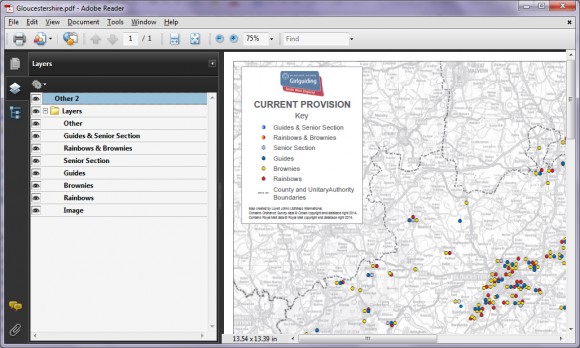
We were approached by Girl Guiding South West England for GIS provision mapping services. Nearly 4,000 provision locations were geocoded by postcode. These were colour coded to distinguish between Rainbows, Brownies, Guides and the Girl Guiding Senior Section services.
Initially, a set of layered PDF maps were produced allowing Girl Guiding South West England to simply view their provision against regional mapping.
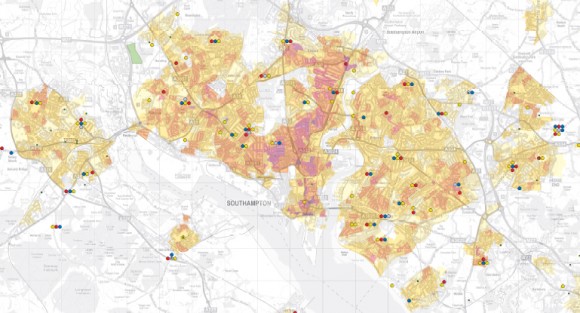
Next, the sample area of Hampshire was chosen to further analyse provision at a local level. Demographic data was collated for the County from 2011 Census data. A GIS layer representing the population density of young people under the age of 26 was collated. This layer was based on Output Areas, the smallest level of geography available from the 2011 Census. This was styled using a ‘heat map’ effect, clearly showing areas of higher density.
A layer of new housing developments was also created. Our own greyscale mapping base was used as a backdrop to allow the user to get a clear sense of geography, but without cluttering or confusing the map. A set of layered PDF’s were produced allowing the users to toggle provisions on and off, and view against the demographic and development data.
As well as viewing and examining data on clear mapping, such data can also be automatically analysed using geoprocessing tools available in GIS; using techniques such as spatial buffering and proximity analysis. Models can then be developed to output or prioritise areas which require more provision.
GIS provision mapping is an essential stage in analysing service provision and communicating why and how provision should be changed.


Comments are closed here.