
You may remember that we developed and maintain the EMODnet Human activities web portal which presents marine and maritime data, collated by our consortium partners, on a range of activities related to the sea.
From a 2016 survey conducted with stakeholders from the marine and maritime community, data on vessel density was found to be the most requested for future inclusion on the portal. gi Perspective were tasked with creating scripts to process ship location data from the Automatic Identification System (AIS) in order to create density maps of the different vessel categories such as cargo, passenger and fishing.
Two main questions quickly arose at this point:
- How do we calculate vessel density?
- How do we process millions of ship locations every month into vessel density maps?
How does AIS work?
AIS is an automated, autonomous transponder system used on board certain vessels. As well as aiding navigation it allows maritime authorities to monitor vessel movements for the purposes of security and safety. Essentially, every so often a vessel with AIS will give out its unique identifier together with its location and speed.
So how does one calculate density? We could of course count the number of AIS signals within a grid square of a predefined size – that would be an easy solution, but signals are not sent using a consistent time interval.
Another option is to create route lines from the sets of locations for each vessel, and total routes within a grid square. This method was considered, but doesn’t take into account a vessel’s speed, so does not really give us density (the concentration of objects in a physical space).
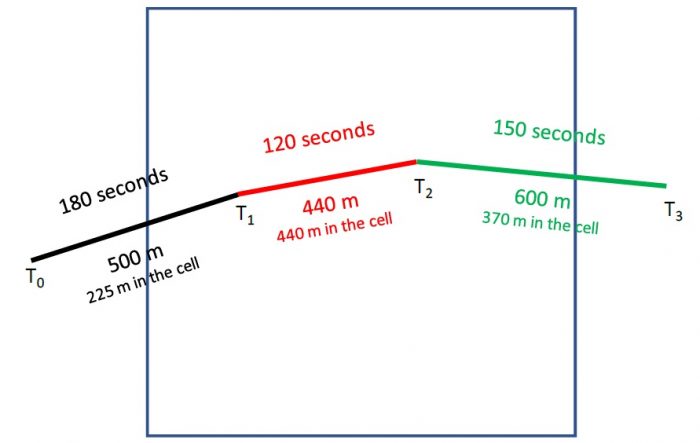
The chosen method also takes into account the time factor. For each set of two AIS locations, we can calculate how long a vessel takes to travel between those two locations, and how far it travels. From this, we can calculate the time spent in each grid cell by all vessels over a predefined time period. In our case, density was defined as vessel hours per square km per month.
The next challenge is how to process the millions of signals every month into map visualisations. To do this, scripting has to be as efficient as possible. Firstly, ArcGIS Desktop is used to pre-process the AIS data into point coordinates in a European map projection (ETRS-LAEA) and combine the date and time attribute into a single unit of time. A second script produced route segments between each set of AIS points and calculated a segment length and time (from the difference between each set of two points).
The next stage is to intersect the routes with a pre-defined 1km grid and total up the total time of all vessels of each category within each grid square. After some testing, it was found that the best environment for this process was the open source database software PostgreSQL, with a spatial GIS extension called PostGIS. A new PC with 10 CPU cores, 32GB of memory and a full 1TB of solid state drive space also helped our consortium partners process the data!
The final stage is to simply turn our grid data into a set of density raster maps for display on the portal.
The output is a set of vessel density maps for every month, split into the following vessel categories:
- Cargo
- Dredging or Underwater ops
- High Speed Craft
- Fishing
- Military and Law Enforcement
Passenger - Pleasure Craft
- Sailing
- Service Tanker
- Tug and Towing
- Other
- Unknown
- All of the above
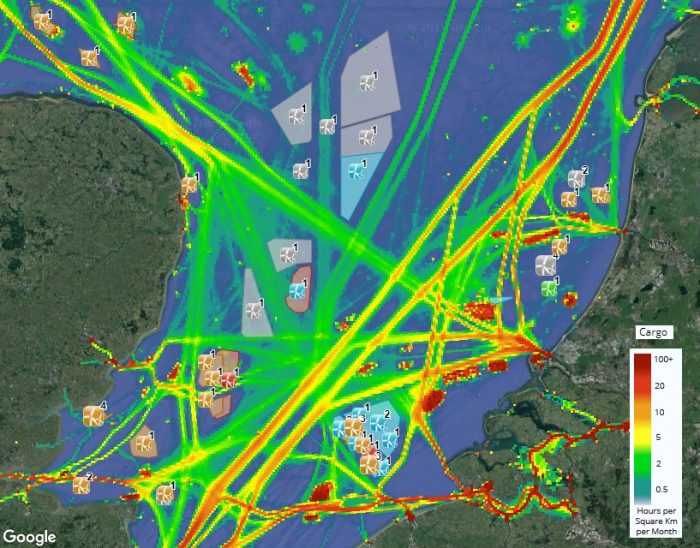
It is interesting to compare and contrast the various categories and view against other Human Activities data. For instance, you can instantly see how cargo shipping lanes avoid wind farms, whereas service vessels regularly visit this locations. You can also see how the density of sailing vessels changes throughout the year.
The data is freely available both to view and download. This opens up the vessel density mapping to many other applications, such as pollution analysis or the monitoring of fishing activity.
A white paper (PDF) is available which explains the above process in more detail. We have also created a Story Map here:
Comments are closed here.