As part of their statutory duties in delivering local planning policies for citizens, local authorities in England and Wales have a duty to comply with the latest guidance and national policy dealing with open spaces, sport and recreation uses across their district. Specifically, the National Planning Policy Framework (NPPF) requires that all councils have an adequate evidence base in place with regard to assessing the need for open space, sports and recreation facilities.
With increasing population densities and new home builds emerging in certain parts of the country, many local authorities must ensure that their Open Space Strategy Reviews are adequate and up to date for decades to come. In short, the tools and techniques for assessment of Open Space provision need to be appropriate, adequate and accurate. We thought we would take a look at how analysis using GIS mapping can add value to Open Space Reviews.
How much, how many and where
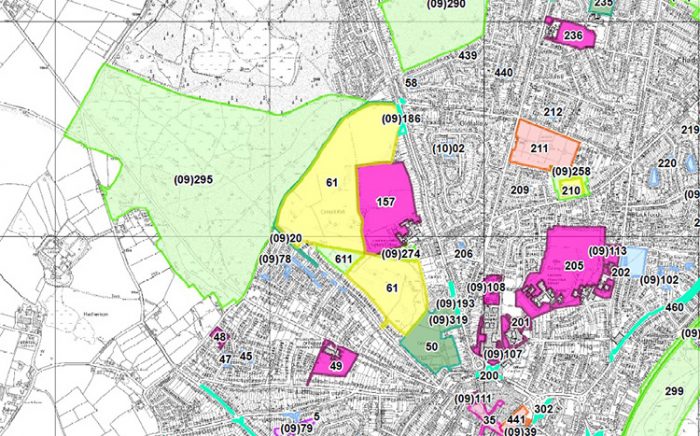
Open Space Reviews will draw on qualitative analysis, for example by using surveys to measure the perceived quality of children’s play parks. GIS mapping however, can help provide the quantitative answers of how much, how many and how often. For example, simply by mapping the current number and type of public parks and gardens by postcode sector or walking distance, spatial analysis provides a valuable insight into current provision levels across the district.
Mapping against other factors
A typical Open Space Review will start with an assessment of the current provision of open space, sports and recreation facilities. Using the provision standards, the Council must assess the current position on quantity, accessibility and quality of available facilities across the district. This assessment will benefit from quantitative analysis provided by GIS mapping, for example mapping the current positions of sports centres in relation to population centres. With population forecasts brought into the workflow, the current provision of those sports centres can be mapped against population projections in 5, 10 years time to inform the surplus / deficit issues in the future.
Analysis at local levels
As well as population, visualising the different types of open spaces, sport and recreation at a Parish or Ward level can describe provision and likely surpluses and deficits at a more useful level. The production of Parish maps can show how outdoor sport facilities or gyms are provided at a local population catchment level. Maps can also factor in neighbouring district facilities for those citizens who may be able to make use of facilities outside the borough boundary, perhaps on their way to and from work. Such GIS maps can be further enriched by bringing in socio-demographic data to add value to the analysis.
Scenario planning
Maps need not only to be static of course. By presenting this data in an online interactive map the data can be filtered for scenarios to answer ‘what if’ questions posed by the different stakeholders. For example, an interactive map can immediately answer questions of how populations and user profiles would be affected by closing an indoor sports hall or green space. Such online mapping can be cost-effective for ongoing reviews and user engagement requirements.
Of course there are many factors involved in an Open Space Review including Sport England guidance, adopted planning policies and potential use of developer contributions. GIS Mapping is proving an extremely useful tool for visualising different datasets to provide a clearer assessment of current and future needs.
Comments are closed here.